The Pro Survey is our standardized survey that includes a predefined set of questions. This standardized questionnaire allows us to build survey norms and have automatic survey metric calculations that appear directly on our dashboard for easy access and segmentation. Here is the link where you can download and preview the Pro questionnaire.
Once your Pro study has completed, you can view the survey results on the dashboard by opening the study to the Charts tab:
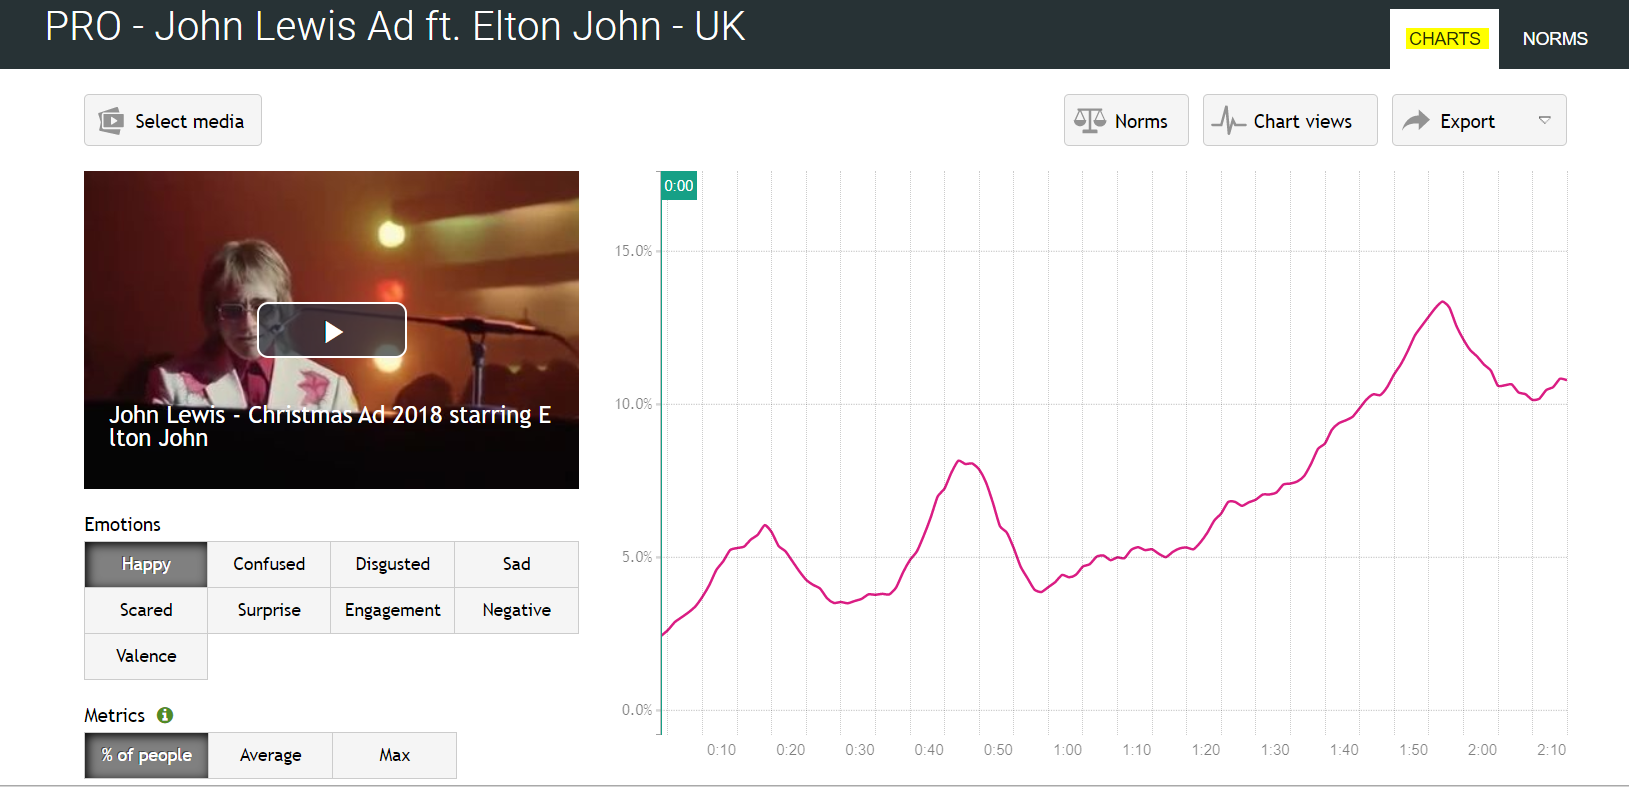
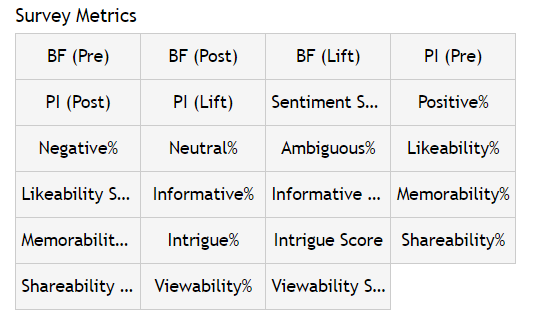
On the left-hand side of the charts page you will see a section titled 'Survey Metrics' under which a number of different measures are listed:
To view the survey results for your video(s), click on each measure that you are interested in. The results will then appear in the summary section on the right-hand side of the screen:
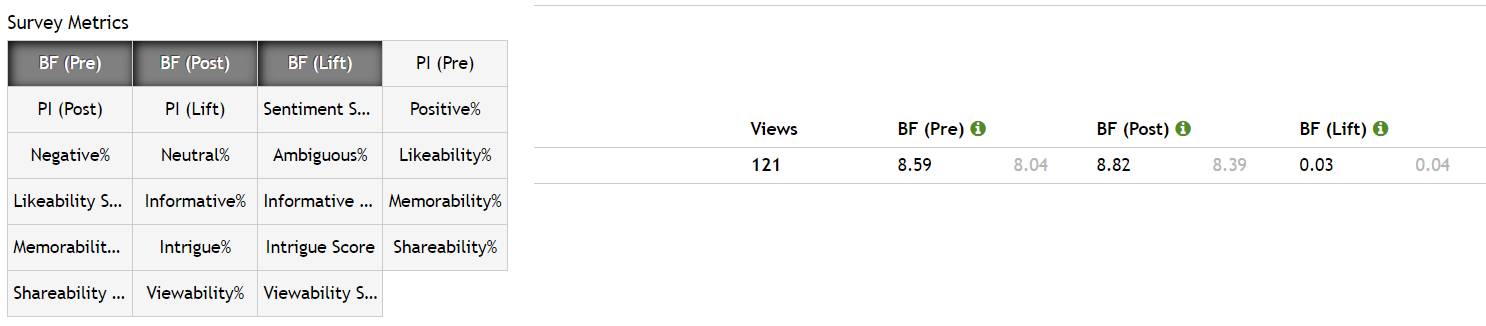
The norms are displayed to the right of your video’s scores in grey for easy comparison. Visit our ‘Creating Custom Norms’ instructions here to learn how to customize the norm that is being used. If the norm is not appearing once you have set it, it is likely that we have not yet tested enough videos in that category. In this case you will just need to broaden the norm that is being applied.
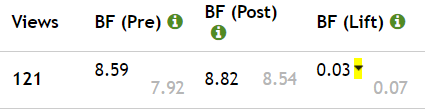
If an upwards facing arrow is displayed next to your video’s score, then it performed significantly above the norm value. If there is a downward facing arrow the video scored significantly lower than norm. No arrow indicates there is not a significant difference between the video and the norm.
The definitions of each of these metrics and which survey question they align with can be found below:
Brand Favorability Metrics (Q4 and Q8):
- BF (Pre) (Q4): The average 1-10 brand favorability rating BEFORE viewing the video
- BF (Post) (Q8): The average 1-10 brand favorability rating AFTER viewing the video
- BF (Lift) (Q4 & Q8): The percentage difference between the POST and PRE viewing groups in average ranking on the 1-10 scale. (POST Group Avg – PRE Group Avg)/PRE Group Avg
- The 1-10 rating scale is based on the following indexing system:
|
Favorability Indexing
|
Score
|
|
Very Positive
|
10
|
|
Somewhat Positive
|
7.75
|
|
Neither Positive nor Negative
|
5.5
|
|
Somewhat Negative
|
3.25
|
|
Very Negative
|
1
|
|
Not Familiar
|
Excluded from calculations
|
Purchase Intent Metrics (Q5 and Q9):
- PI (Pre) (Q5): The average 1-10 purchase intent rating BEFORE viewing the video
- PI (Post) (Q9): The average 1-10 purchase intent rating AFTER viewing the video
- PI (Lift) (Q5 & Q9): The percentage difference between the POST and PRE viewing groups in average ranking on the 1-10 scale. (POST Group Avg – PRE Group Avg)/PRE Group Avg
- The 1-10 rating scale is based on the following indexing system:
|
Purchase Intent Indexing
|
Score
|
|
Very Likely
|
10
|
|
Somewhat Likely
|
7.75
|
|
Neither Likely nor Unlikely
|
5.5
|
|
Somewhat Unlikely
|
3.25
|
|
Very Unlikely
|
1
|
|
Not Familiar
|
Excluded from calculations
|
Sentiment Analysis Metric (Q6):
- Sentiment Score: A single score that indicates overall emotional sentiment of open-ended responses on a positive to negative scale of +10 to -10.
- Positive%: The percentage of open-ended responses that are categorized by our algorithms as positive
- Negative%: The percentage of open-ended responses that are categorized by our algorithms as negative
- Neutral%: The percentage of open-ended responses that are categorized by our algorithms as Neutral
- Ambiguous%: The percentage of open-ended responses that are categorized by our algorithms as ambiguous (contain both positive and negative statements)
Campaign Objectives (Q10)
- I like the video
- Likeability%: The percentage of top-2-box answers (Strongly Agree/Somewhat Agree)
- Likeability Score: The average 1-10 ranking on the agreement scale
- The video has interesting information
- Informative%: The percentage of top-2-box answers (Strongly Agree/Somewhat Agree)
- Informative Score: The average 1-10 ranking on the agreement scale
- I would remember the video
- Memorability%: The percentage of top-2-box answers (Strongly Agree/Somewhat Agree)
- Memorability Score: The average 1-10 ranking on the agreement scale
- I want to know more about what is advertised in the video
- Intrigue%: The percentage of top-2-box answers (Strongly Agree/Somewhat Agree)
- Intrigue Score: The average 1-10 ranking on the agreement scale
- I would share the video on social media
- Shareability%: The percentage of top-2-box answers (Strongly Agree/Somewhat Agree)
- Shareability Score: The average 1-10 ranking on the agreement scale
- I would watch the video again
- Viewability%: The percentage of top-2-box answers (Strongly Agree/Somewhat Agree)
- Viewability Score: The average 1-10 ranking on the agreement scale
- The 1-10 rating scale is based on the following indexing system:
|
Agreement Scale Indexing
|
Score
|
|
Strongly Agree
|
10
|
|
Somewhat Agree
|
7.75
|
|
Neither Agree nor Disagree
|
5.5
|
|
Somewhat Disagree
|
3.25
|
|
Strongly Disagree
|
1
|
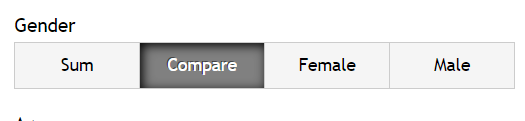
In addition to the automatically calculated metrics, filters for each question can be found on the left-hand side of the page. These filters allow you to view the percentage of people that selected each answer option and to segment the emotions data by selected answers.
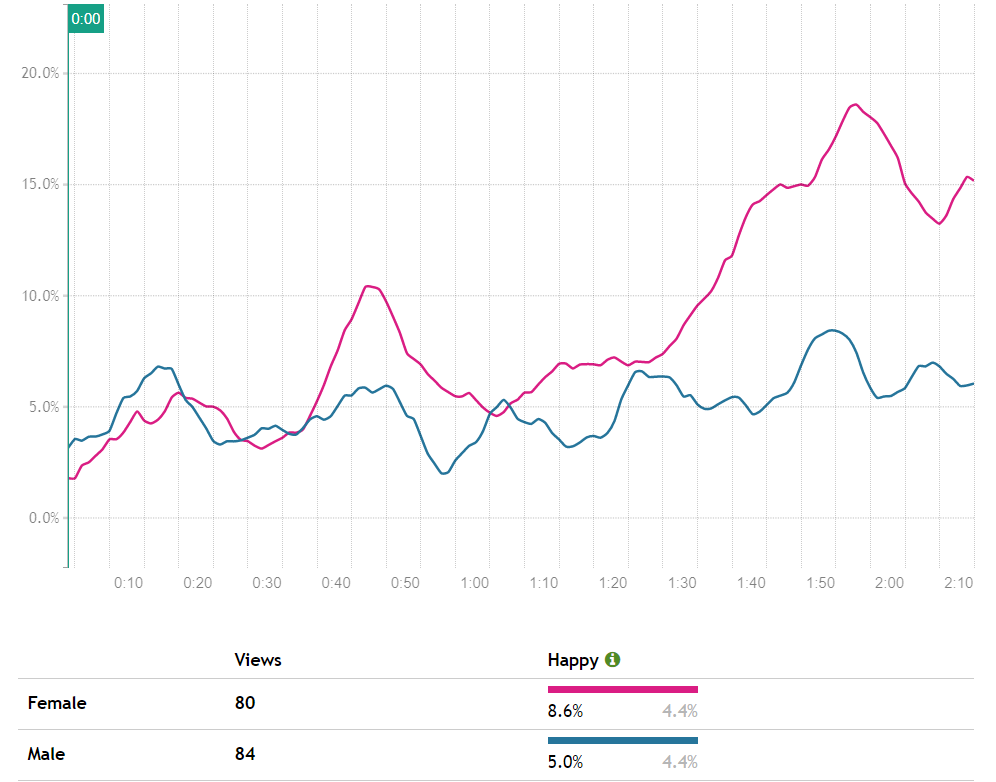
For example, by clicking ‘Compare’ under 'Gender', you will be able to look at the emotions results segmented by those who identified as male' and those who identified as 'female':
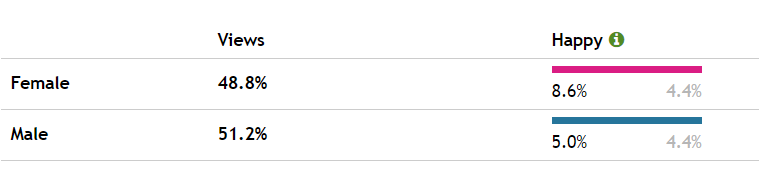
You can change the numbers under the views section to show the percentage of people that fall into each group by clicking on the ‘Views’ label:
The following filters are included on the dashboard by default:
Pre/Post Brand Favorability and Pre/Post Purchase Intent:
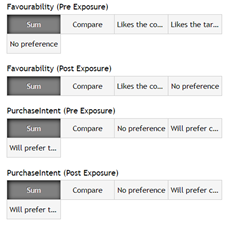
- Target Brand: the target brand was rated higher than all competitor brands
- No Preference: the target brand and at least 1 competitor brand were rated equally as highest
- Competitor Brand: at least 1 competitor brand was rated higher than the target Brand
Sentiment Analysis:
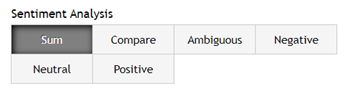
- Positive: open-ended responses are categorized by our algorithms as positive
- Negative: open-ended responses are categorized by our algorithms as negative
- Neutral: open-ended responses are categorized by our algorithms as neutral
- Ambiguous: open-ended responses are categorized by our algorithms as ambiguous (contain both positive and negative statements)
Campaign Objective Agreement:
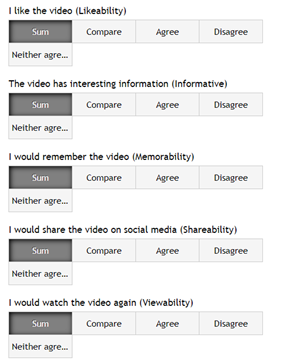
- Agree: either Strongly Agree or Somewhat Agree selected (Top-2-Box)
- Disagree: either Somewhat Disagree or Strongly Disagree selected (Bottom-2-Box)
- Neither Agree nor Disagree: neither agree nor disagree selected